Startup Growth Analytics


Generating thumbnail...
Startup Growth Analytics
This project implements a comprehensive MLOps pipeline for analyzing startup growthpatterns and predicting success metrics. Using real-world startup data, we developed anend-to-end machine learning solution that processes data, engineers features, trains models, evaluates performance, and deploys a production-ready API
Bharathsimha Reddy Putta
other
Project Overview
Project Claps
Recent Clappers
Showing 2 of 2 clappers
Key Features
Complete MLOps Workflow
The project implements a fully automated six-stage MLOps pipeline covering every step from data ingestion to deployment. It ensures complete reproducibility through DVC (Data Version Control), allowing users to reproduce the workflow with a single command. Configuration parameters are managed through a centralized YAML file, enabling flexible experimentation without code changes. Logging is implemented at every stage to monitor operations and capture execution details. This setup ensures modularity, transparency, and end-to-end automation. The result is a robust, production-grade pipeline that aligns with industry MLOps standards.
Data Processing
The data processing pipeline intelligently handles missing values using median imputation for numerical columns and mode imputation for categorical ones. Duplicate records are detected and removed to ensure clean and high-quality data. Categorical columns such as “Industry,” “Region,” and “Exit Status” are label-encoded, and numerical columns are normalized using the StandardScaler. New features like “Startup Age” and “Success Status” are engineered to capture business-relevant insights. The processed data is then split into training and testing sets in an 80/20 ratio for model development. These transformations make the dataset ready for effective machine learning.
Machine Learning
A Random Forest Classifier serves as the core machine learning model, chosen for its robustness and interpretability. Hyperparameters such as the number of estimators, maximum depth, and class weights are optimized for balanced performance. The training pipeline includes model serialization using Joblib, allowing easy reuse in production. Feature importance analysis identifies which startup metrics contribute most to success. Cross-validation ensures generalization, and detailed metrics are computed to evaluate model reliability. Together, these methods produce a high-performing, explainable model ideal for predictive analytics.
Visualizations
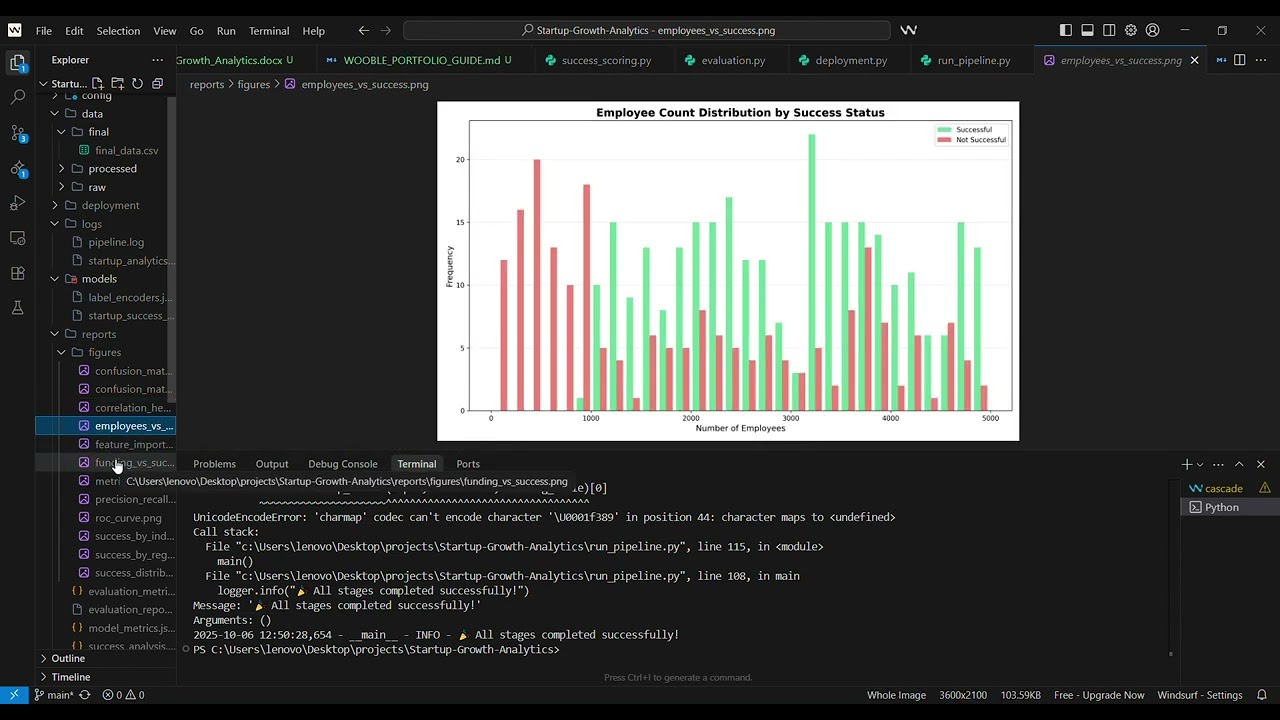
The project features more than twelve high-resolution (300 DPI) visualizations that reveal critical business and model insights. Charts include startup success distributions, industry and regional performance comparisons, and relationships between funding, employees, and success. A correlation heatmap highlights interdependencies among features. Model evaluation visuals such as ROC curves, Precision-Recall plots, and confusion matrices illustrate performance metrics. All plots maintain professional styling with clear labels, legends, and value annotations, suitable for reports and presentations. These visuals make data interpretation and storytelling both effective and insightful.
Production Deployment
The deployment phase introduces a production-ready Flask REST API that exposes prediction and health check endpoints. It allows real-time predictions of startup success probabilities using JSON-based inputs and outputs. The API is containerized with Docker, ensuring portability and cloud readiness. Gunicorn is configured as the production WSGI server for optimized performance. Error handling and input validation are built in for reliability. This setup ensures smooth deployment on platforms like AWS, Google Cloud, Azure, or Heroku with minimal configuration changes.
Documentation
Comprehensive documentation ensures that every component of the project is understandable and reproducible. The main 46 KB Word document includes a professional layout with an executive summary, workflow explanation, and visualizations. Supporting documents such as README files, pipeline guides, troubleshooting notes, and deployment instructions are included for clarity. Code is fully documented with inline comments, function docstrings, and type hints for maintainability. The documentation also includes a Wooble portfolio guide and API usage instructions. Together, they provide complete technical and business transparency.
Success Scoring & Insights
The success scoring stage generates key insights into what drives startup success across industries and regions. It calculates success rates, ranks top-performing sectors, and identifies geographical trends. Funding and team size analyses reveal optimal growth patterns for different startup types. Automated insights are generated and stored in JSON format for easy interpretation. The visual results provide actionable takeaways for investors, founders, and analysts. This stage bridges raw data with meaningful business intelligence.
Model Evaluation
Model evaluation is a crucial phase that tests the trained Random Forest model on unseen data to measure performance. Metrics such as accuracy, precision, recall, F1 score, and ROC AUC are computed and compared. Visual evaluations include ROC and Precision-Recall curves, along with detailed confusion matrices. A classification report provides per-class metrics, offering transparency into model predictions. Evaluation results are exported to both JSON and TXT formats for record-keeping. This ensures confidence in the model’s ability to generalize effectively.
Configuration Management
All parameters controlling the pipeline are stored in a YAML configuration file for easy access and versioning. It includes paths, thresholds, model hyperparameters, feature lists, and logging settings. This approach enables flexible modifications without altering code, ensuring a clean separation of logic and configuration. DVC integrates with these files to track versions and manage pipeline dependencies. Environment-specific configurations support both development and production setups. This makes the project adaptable, scalable, and maintainable across systems.
Logging & Monitoring
The project employs a structured logging system that captures information at multiple levels — INFO, WARNING, ERROR, and DEBUG. Logs are saved both to the console and persistent files, enabling easy debugging and traceability. Each operation is timestamped and categorized by stage for quick reference. The logging mechanism monitors pipeline progress and records error tracebacks if failures occur. Stage completion messages help track execution flow and success status. This robust logging ensures reliability and accountability across all pipeline stages.
Scalability & Performance Optimization
Performance is optimized through efficient data processing using pandas and parallel computation for Random Forest models. The DVC caching mechanism prevents redundant computation, improving execution speed. Memory management strategies ensure smooth handling of large datasets. The modular design allows new models, visualizations, or stages to be added without breaking existing functionality. Configuration-driven architecture further enhances extensibility. As a result, the system scales seamlessly from local machines to cloud-based deployments.
Project Images
Project Videos
Project Documents
View and download project files
Bharathsimha_Reddy_Startup_Growth_Analytics
PDF Document
Discussion
Please log in to join the discussion.


